
Description
Give your sound somewhere to live.
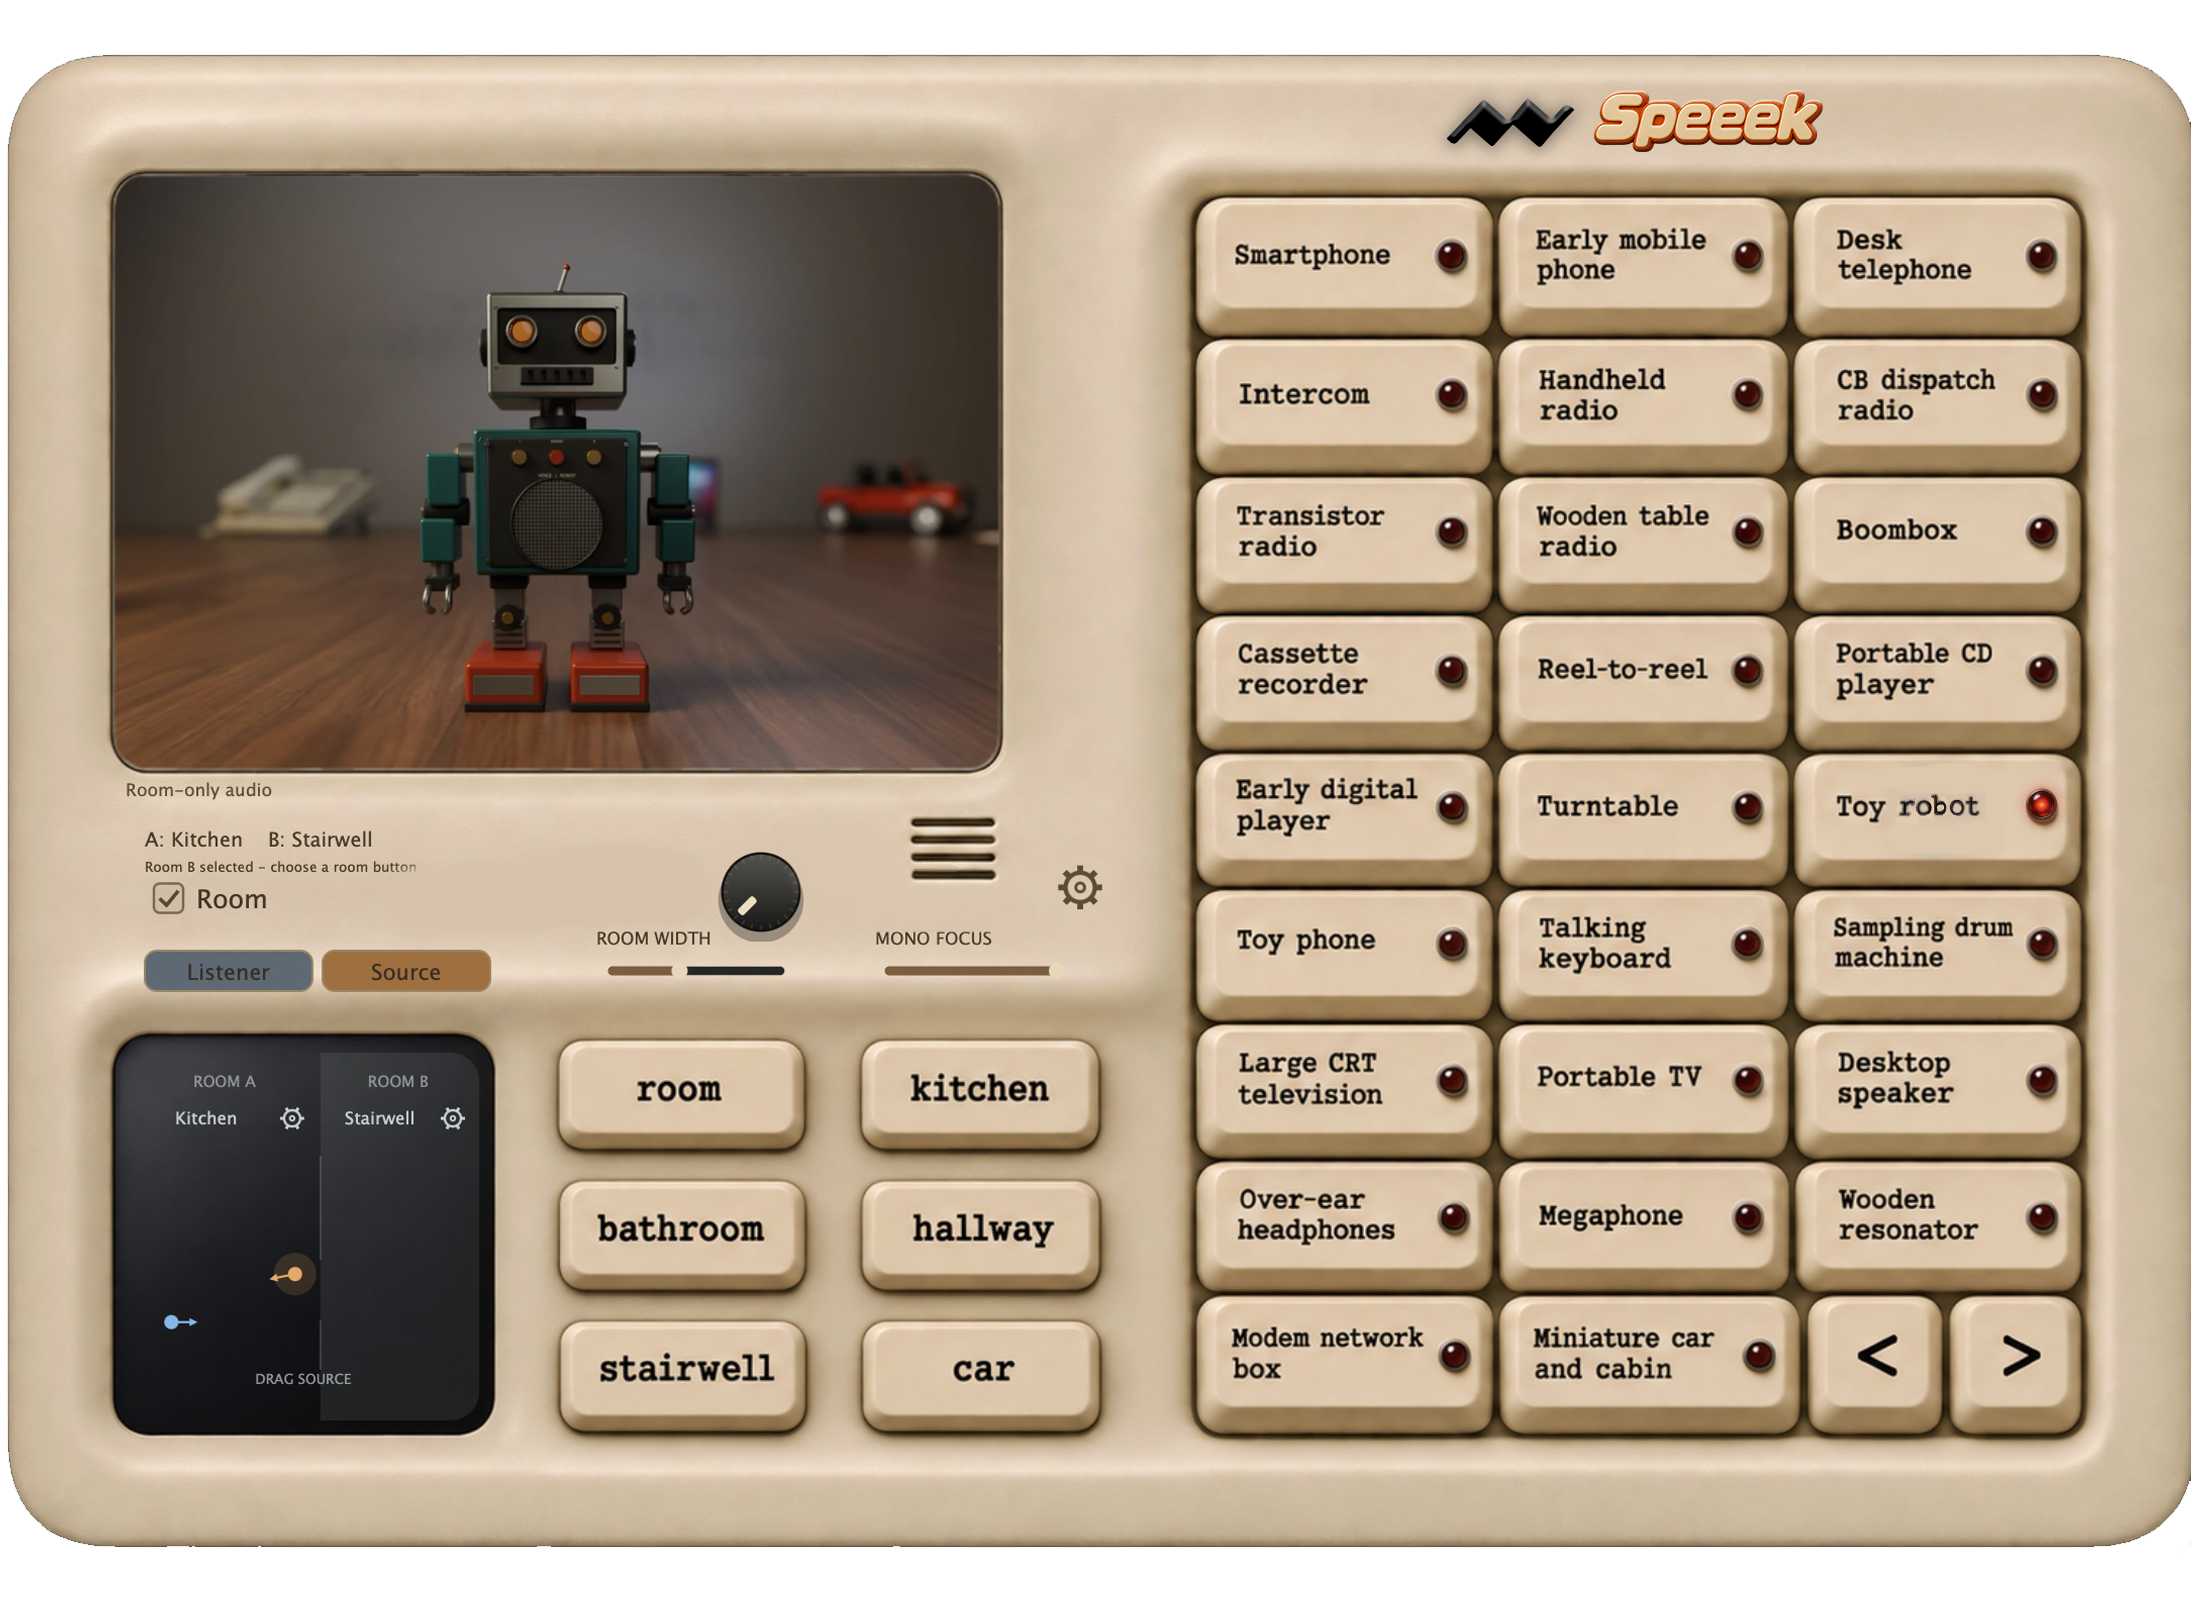
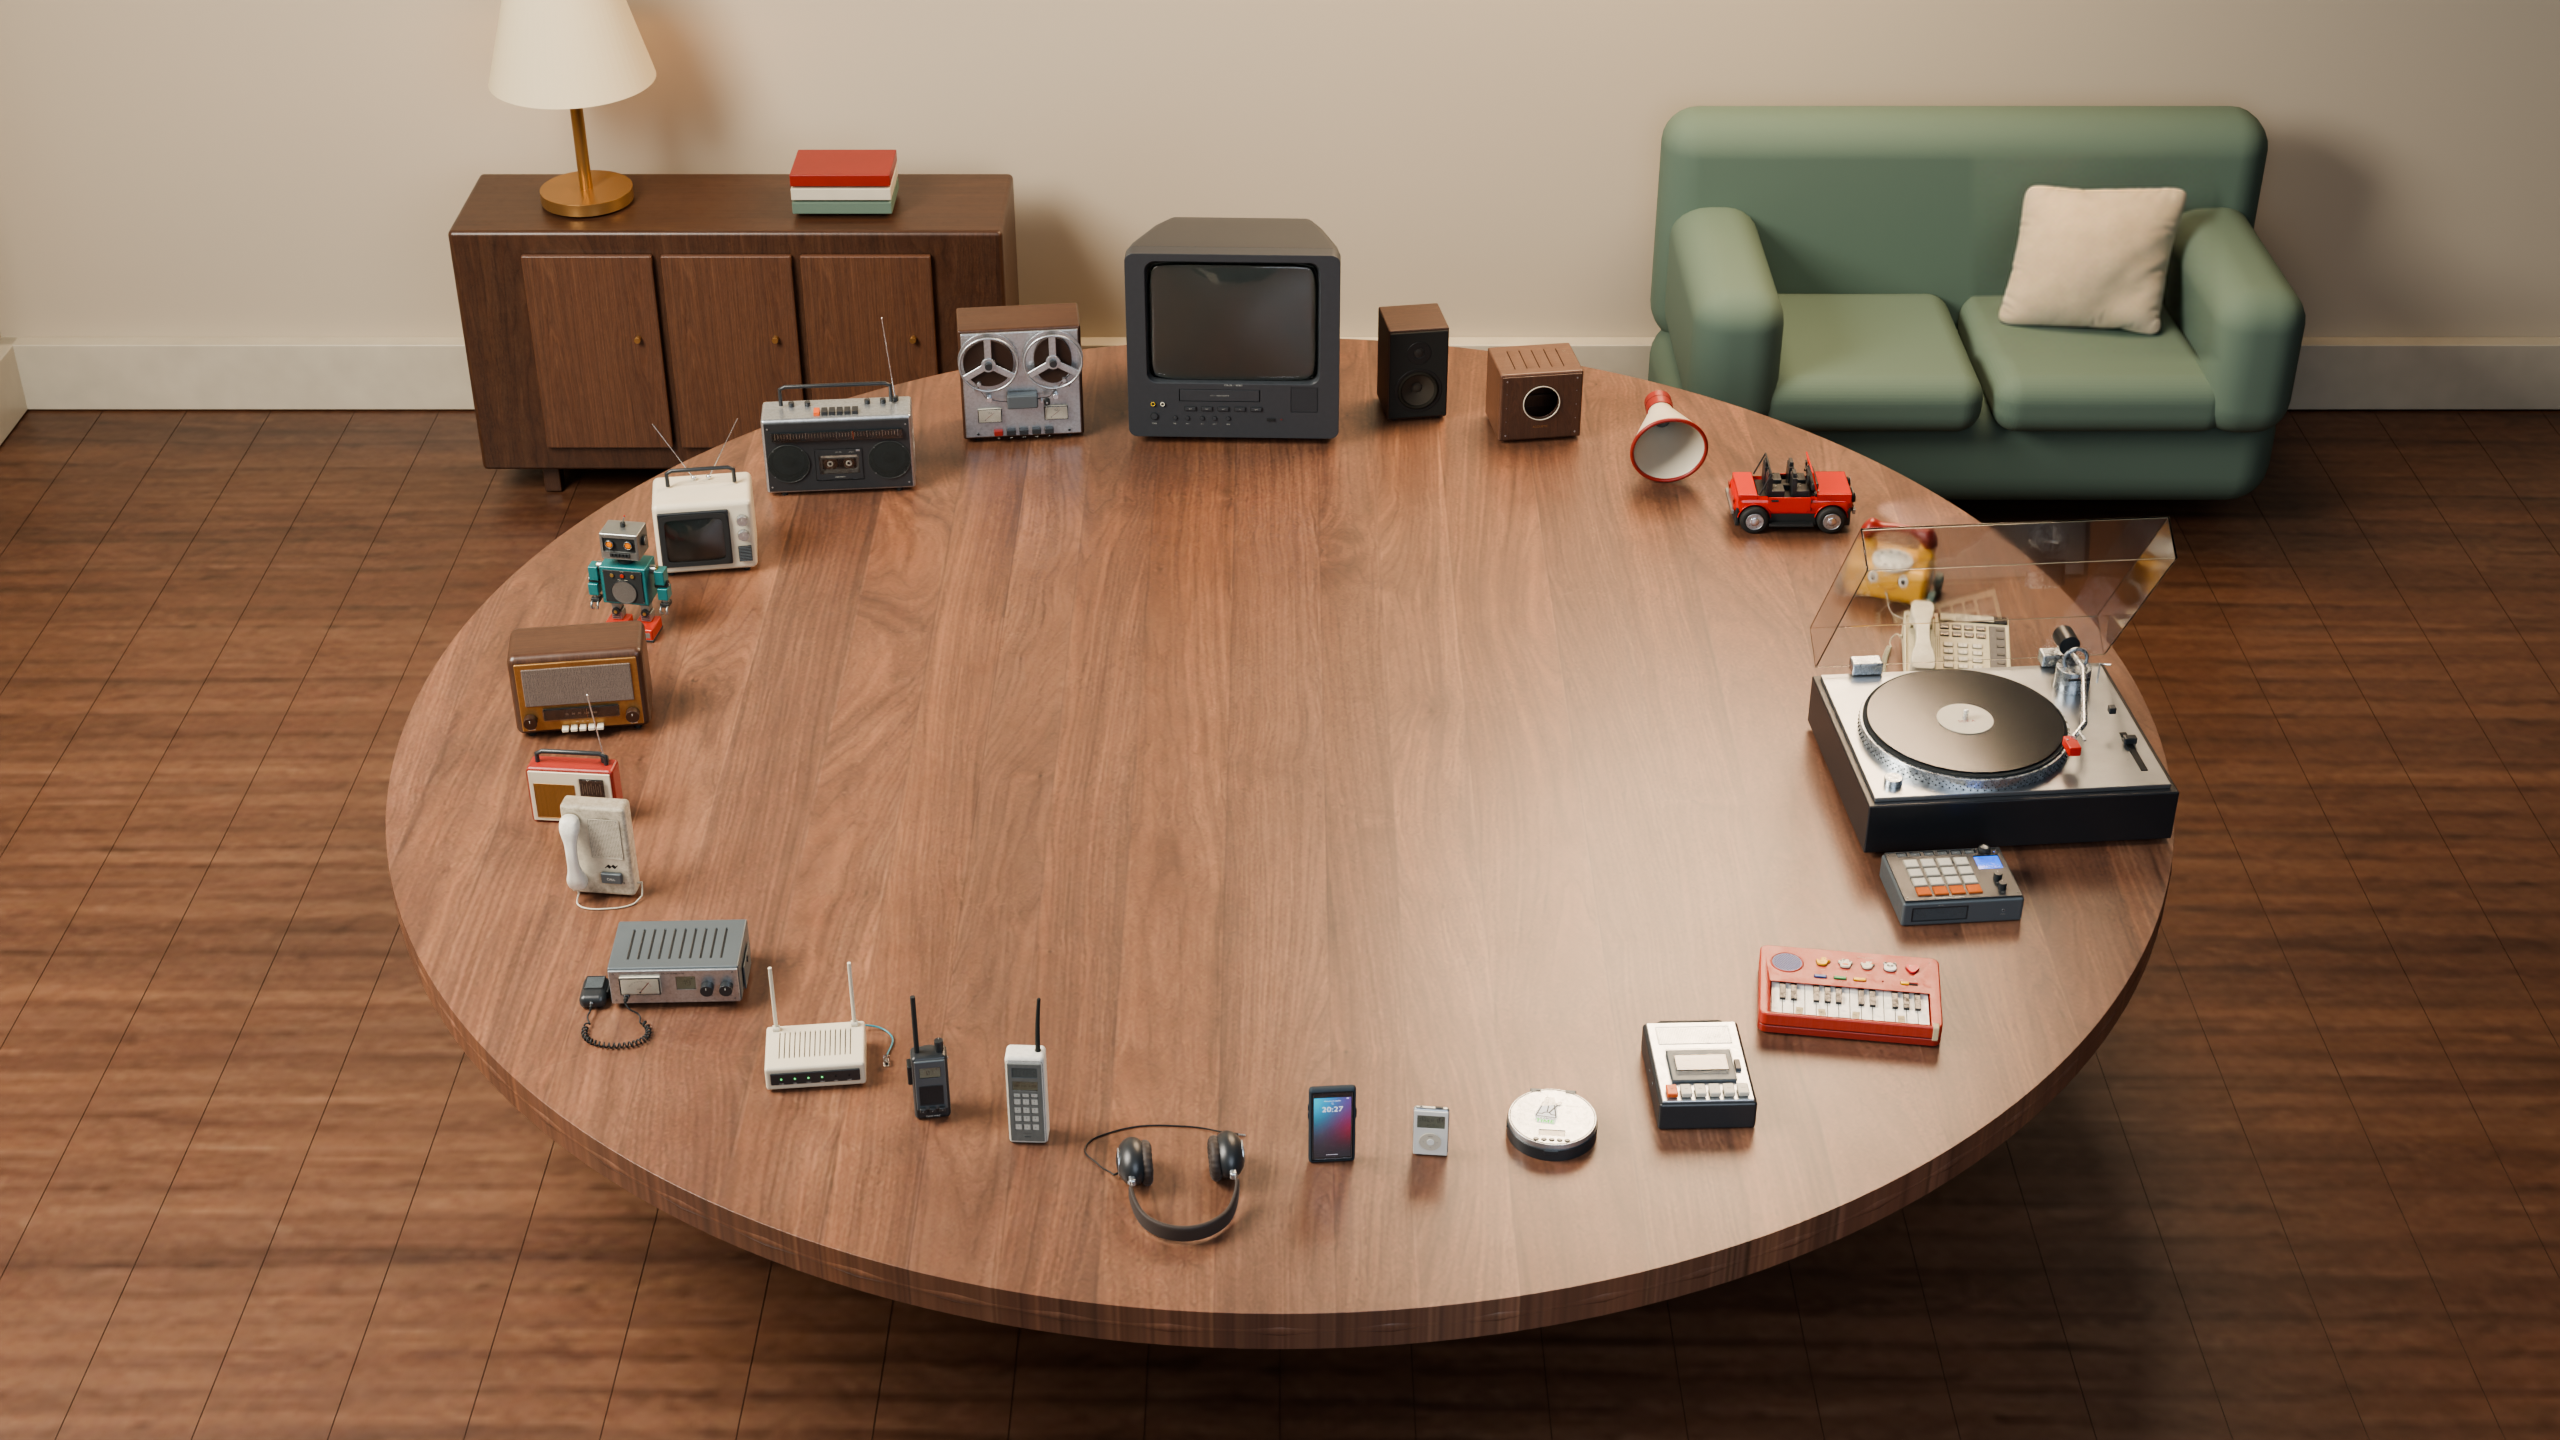
Speeek is an upcoming audio effects plugin from Melodynamic Studios for games, film and creative sound design. Give clean audio the character of a television, radio, telephone or talking toy, then place that sound in a room.
- Explore the sound of everyday speakers, playback devices and toys.
- Combine device character with room ambience and reverb.
- Build scenes around kitchens, bathrooms, hallways, stairwells and other spaces.
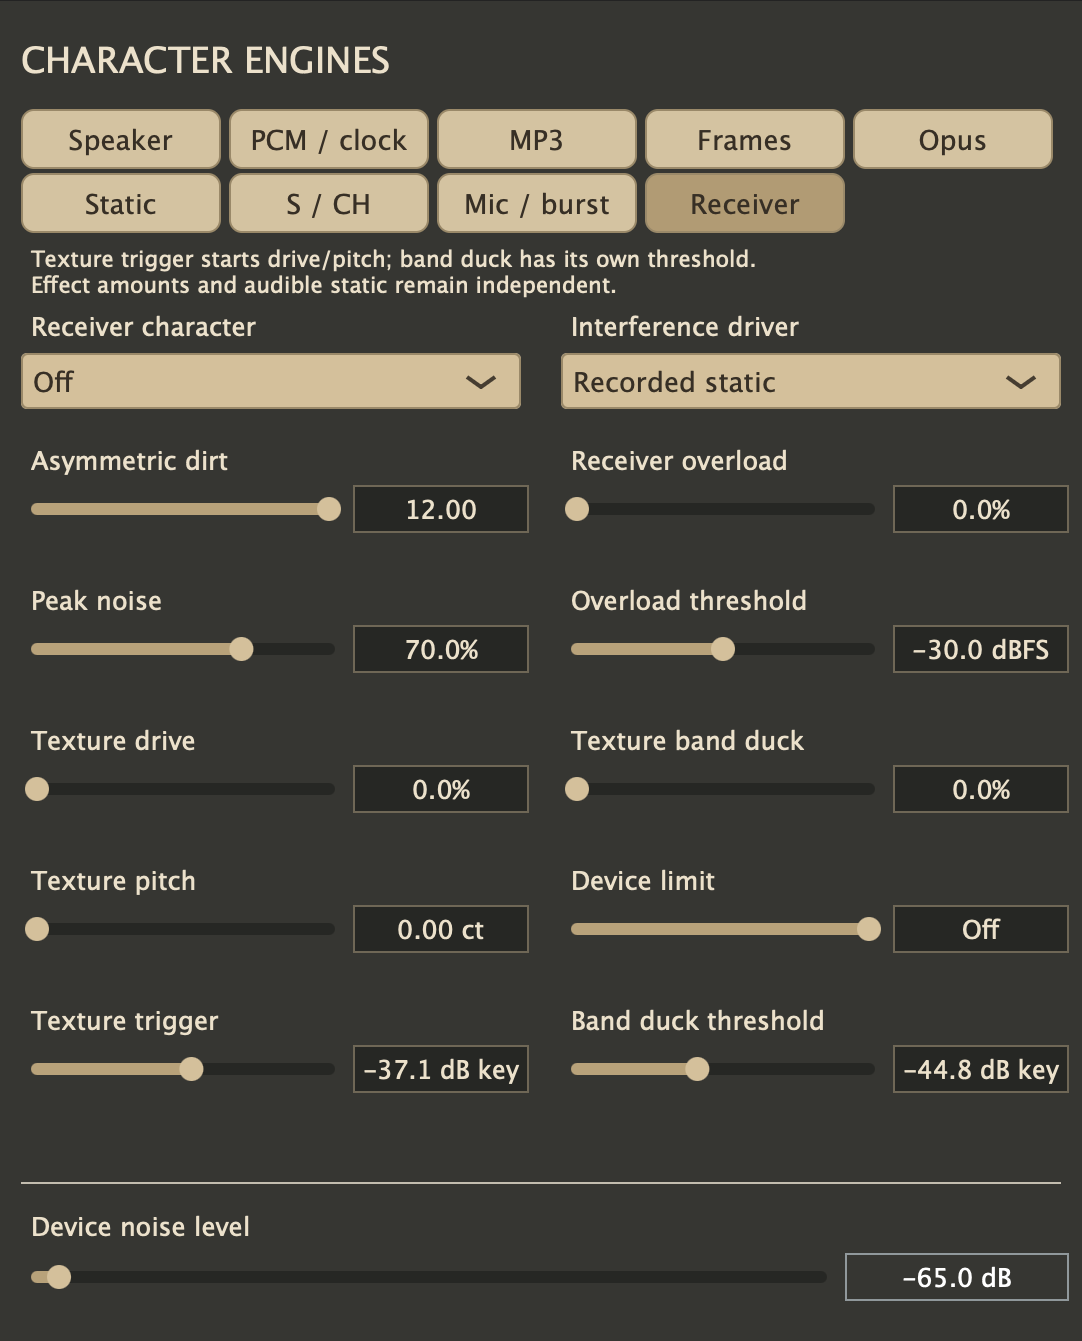
- Shape texture, noise and receiver character for more personality.
MELODYNAMIC STUDIOS | RESEARCH & DEVELOPMENT
Signal processing and acoustic response
Speeek combines captured impulse responses with signal-dependent processing and spatial acoustics. These experiments examine spectral coloration, multiband dynamics, digital coding and room response.
Measurements of the implemented processor are identified separately from numerical modelling experiments. Each comparison uses a common input and documented analysis conditions.
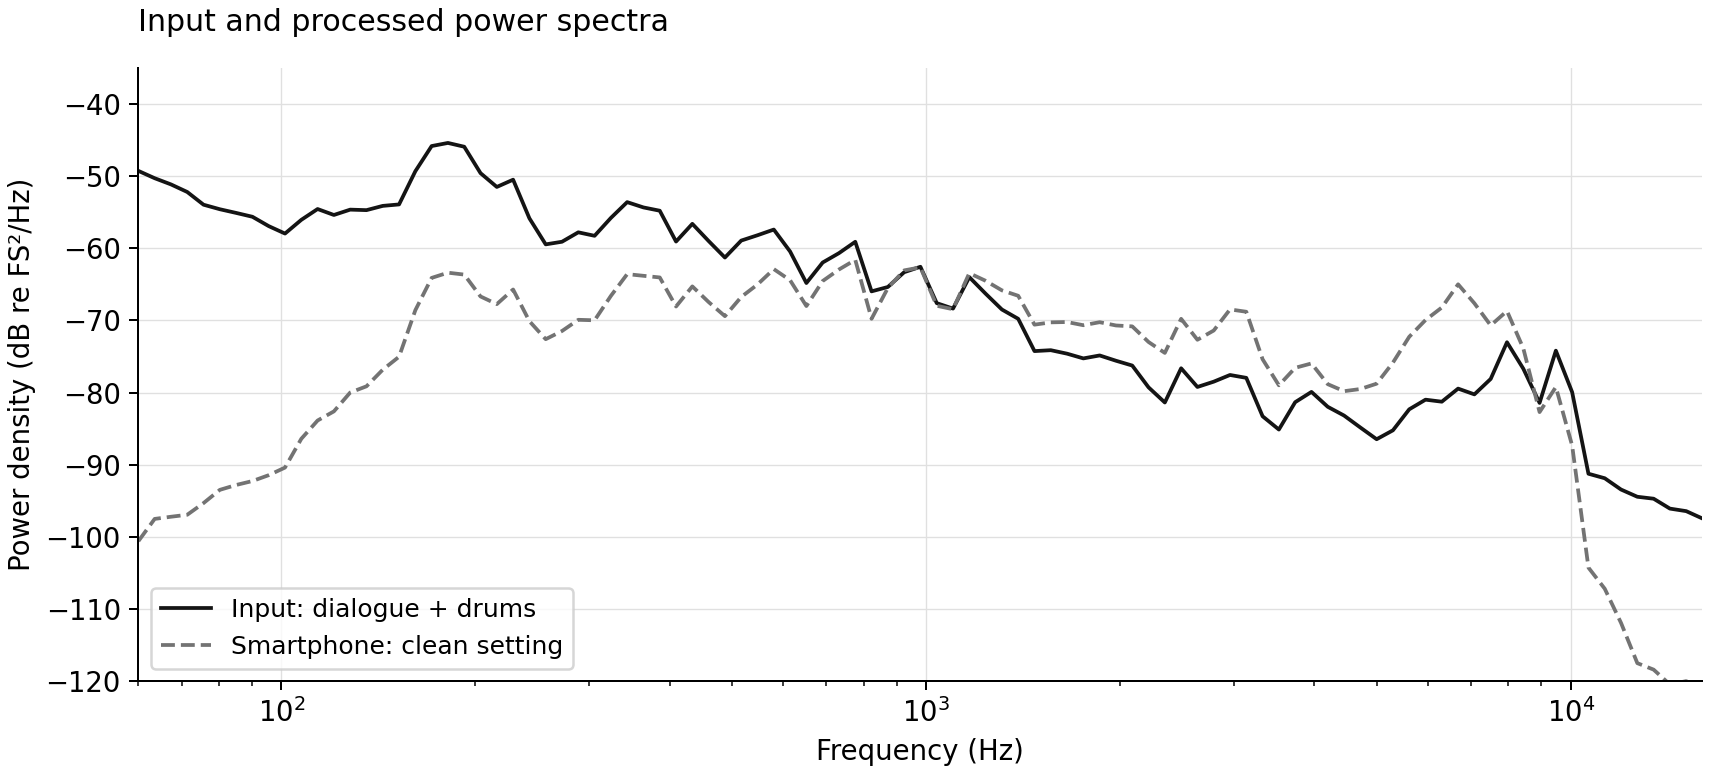
Spectrum : Input and processed power spectra
Method and interpretation
Sampling frequency: 48 kHz. Fixed processing latency was removed before comparison. Power spectral density was estimated using the Welch method with an 8192-sample Hann window, 50% overlap and one-twelfth-octave power averaging. Stereo channel powers were averaged. The curves were not normalized independently. The vertical reference is full-scale amplitude squared per hertz. This is a signal-based spectral comparison, rather than a hardware transfer-function measurement.
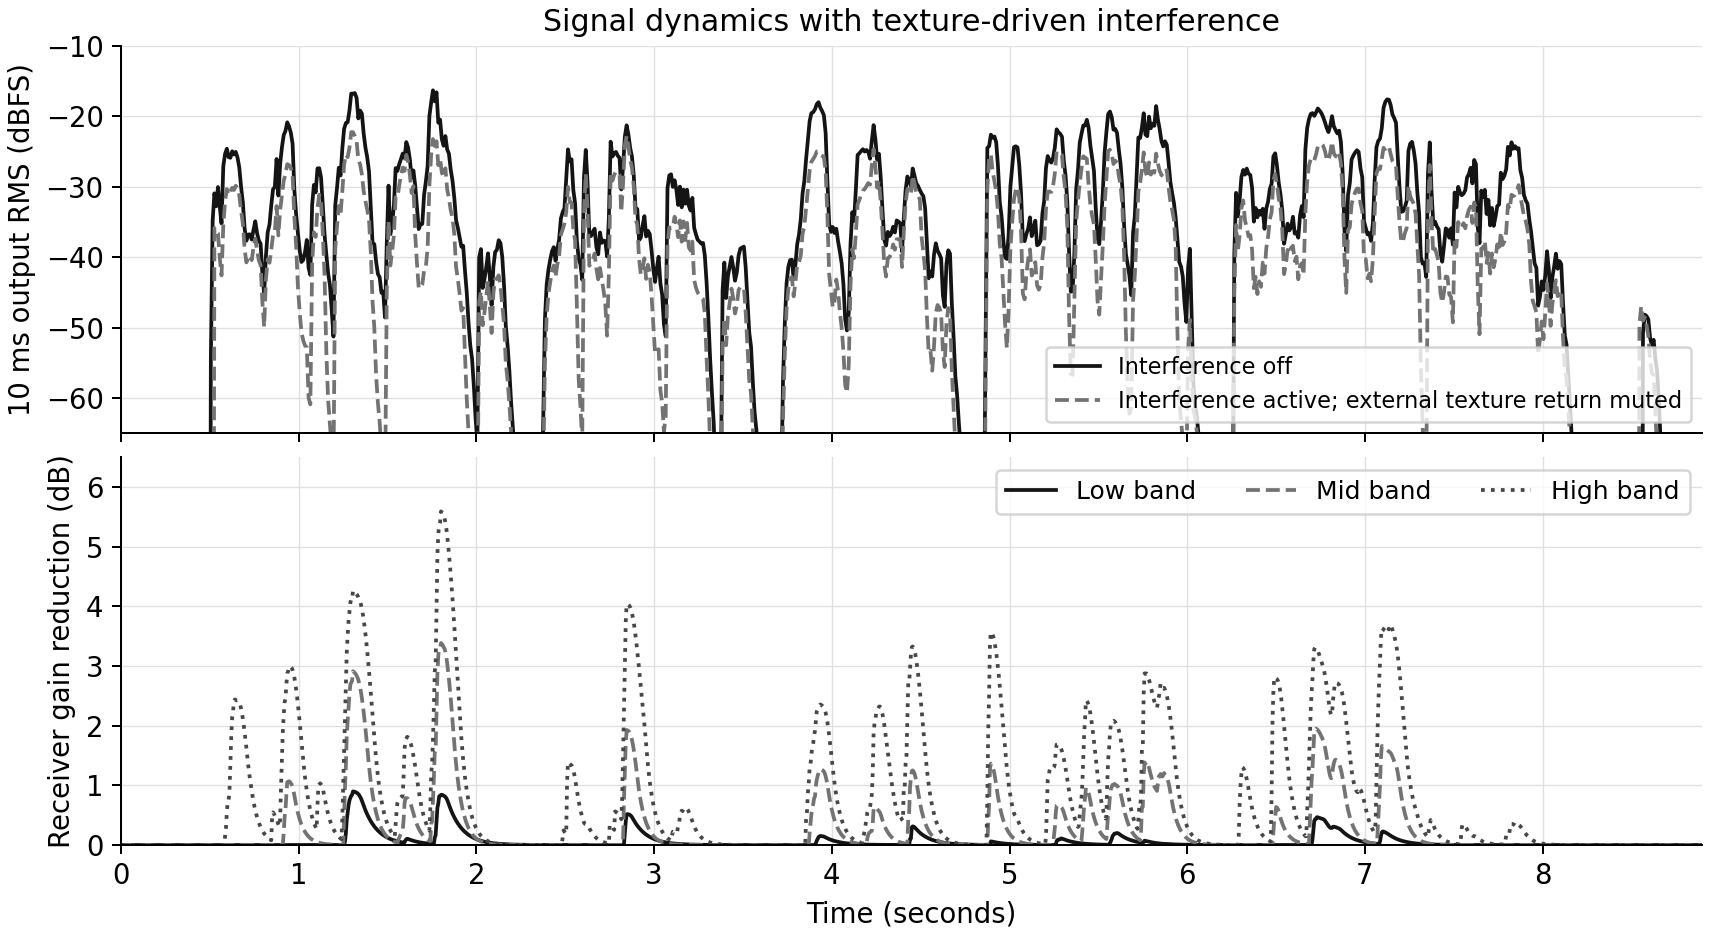
Dynamics : Interference-driven multiband response
Method and interpretation
Two renders from the implemented processor used identical input audio, random seed and output gain. Damage was set to zero. One condition disabled Interference; the other enabled its control path while muting the recorded interference return. Receiver-generated noise and existing nonlinear stages were retained in both conditions. Output RMS was calculated over 10 ms windows; band gain-reduction states were sampled every 5 ms. Time includes processing latency. The comparison characterizes the combined interference path, rather than an isolated compressor.
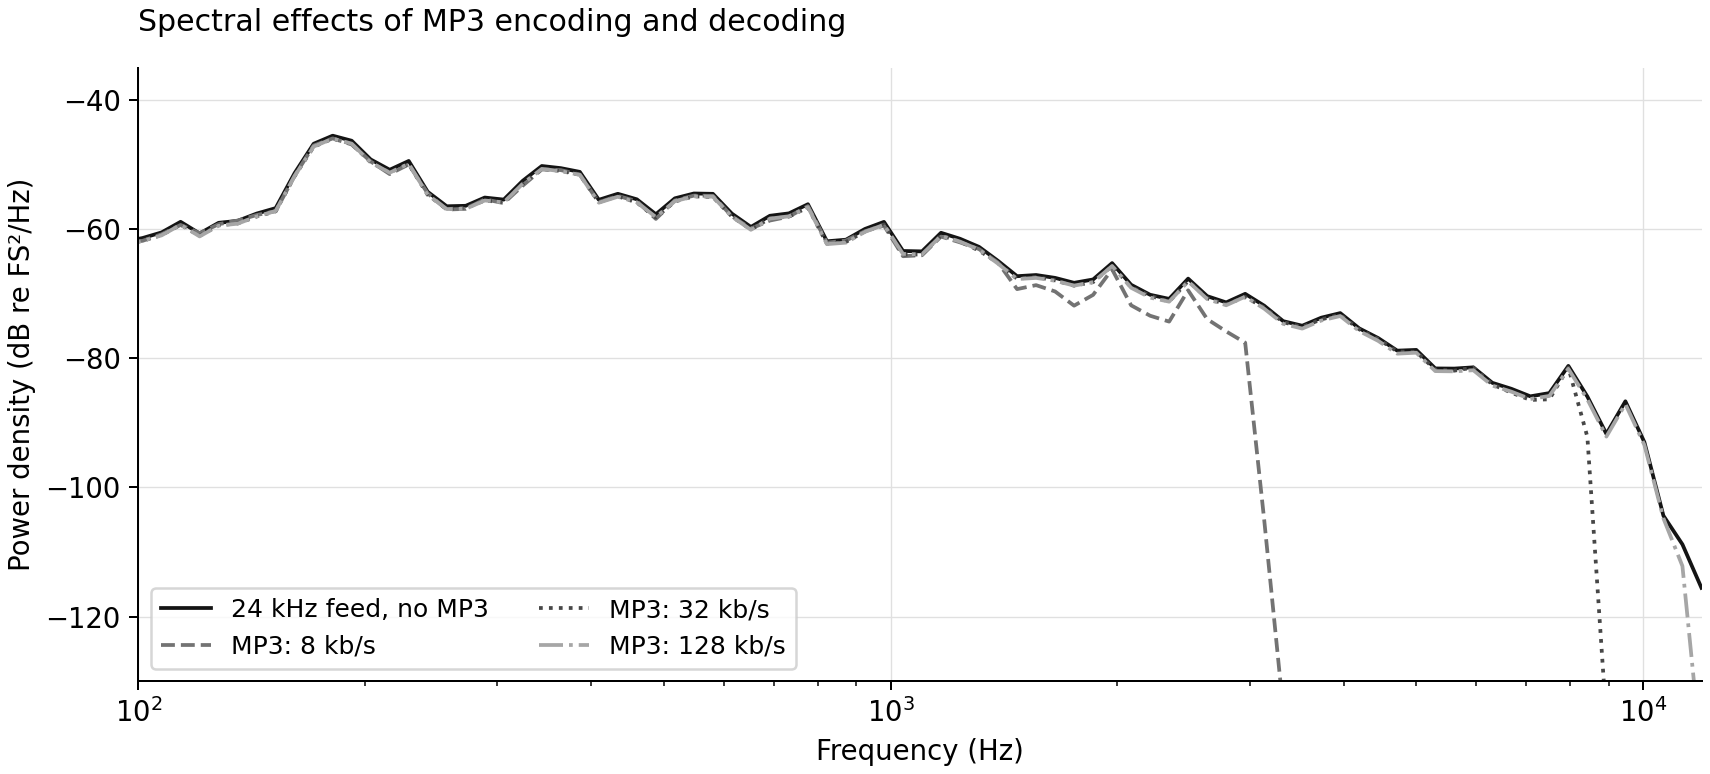
Digital coding : Spectral effects of MP3 bitrate
Method and interpretation
The isolated encoder-decoder experiment used LAME 3.100 and the HIP decoder, a mono 24 kHz input, 16-bit input/output, constant bitrate, the encoder default low-pass filter and common gain. Spectra were estimated with an 8192-sample Hann window, 50% overlap and one-twelfth-octave power averaging. The 8 kb/s condition is an experimental setting. These spectra characterize bandwidth and energy distribution; transient smearing and packet-loss behavior require separate time-domain analysis.
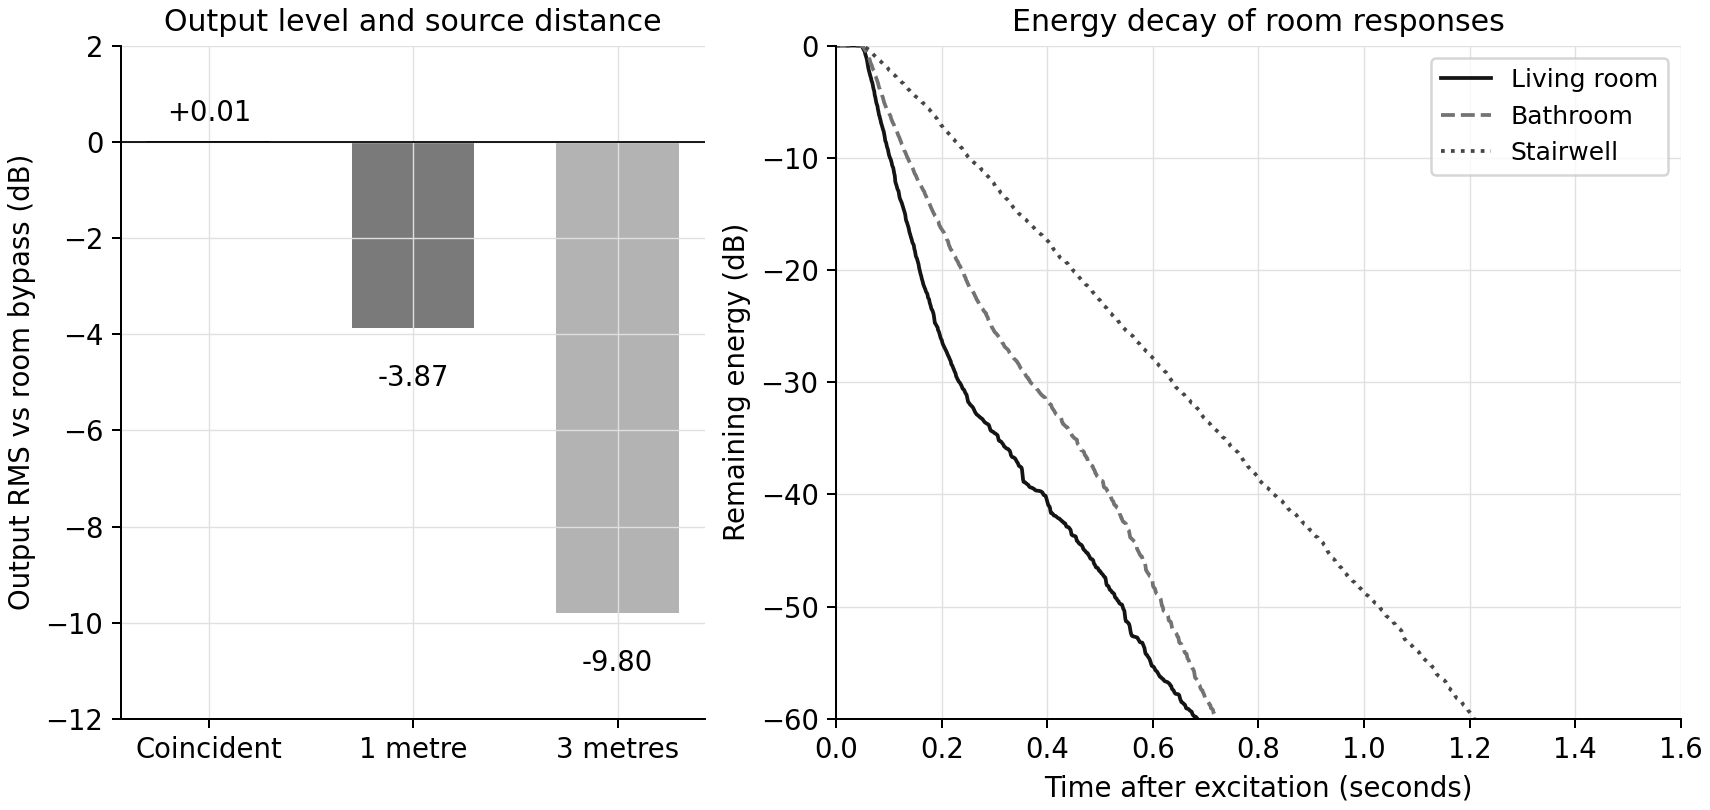
Acoustic space : Source distance and reverberant decay
Method and interpretation
The distance test used the same dialogue and drum loop at 48 kHz, fixed device settings and gain, an on-axis source, and no added distance offset. RMS was calculated across each complete render, including its retained reverberant tail. Relative levels were +0.0067 dB at coincident positions, -3.8714 dB at 1 m and -9.8018 dB at 3 m. The decay curves were calculated by reverse integration of squared impulse-response samples, with channel energies averaged and each curve normalized to its initial energy. The stored responses represent selected room conditions; no new in situ room measurements were made for this figure.
Resonance : Level dependence and cavity modulation
Method and interpretation
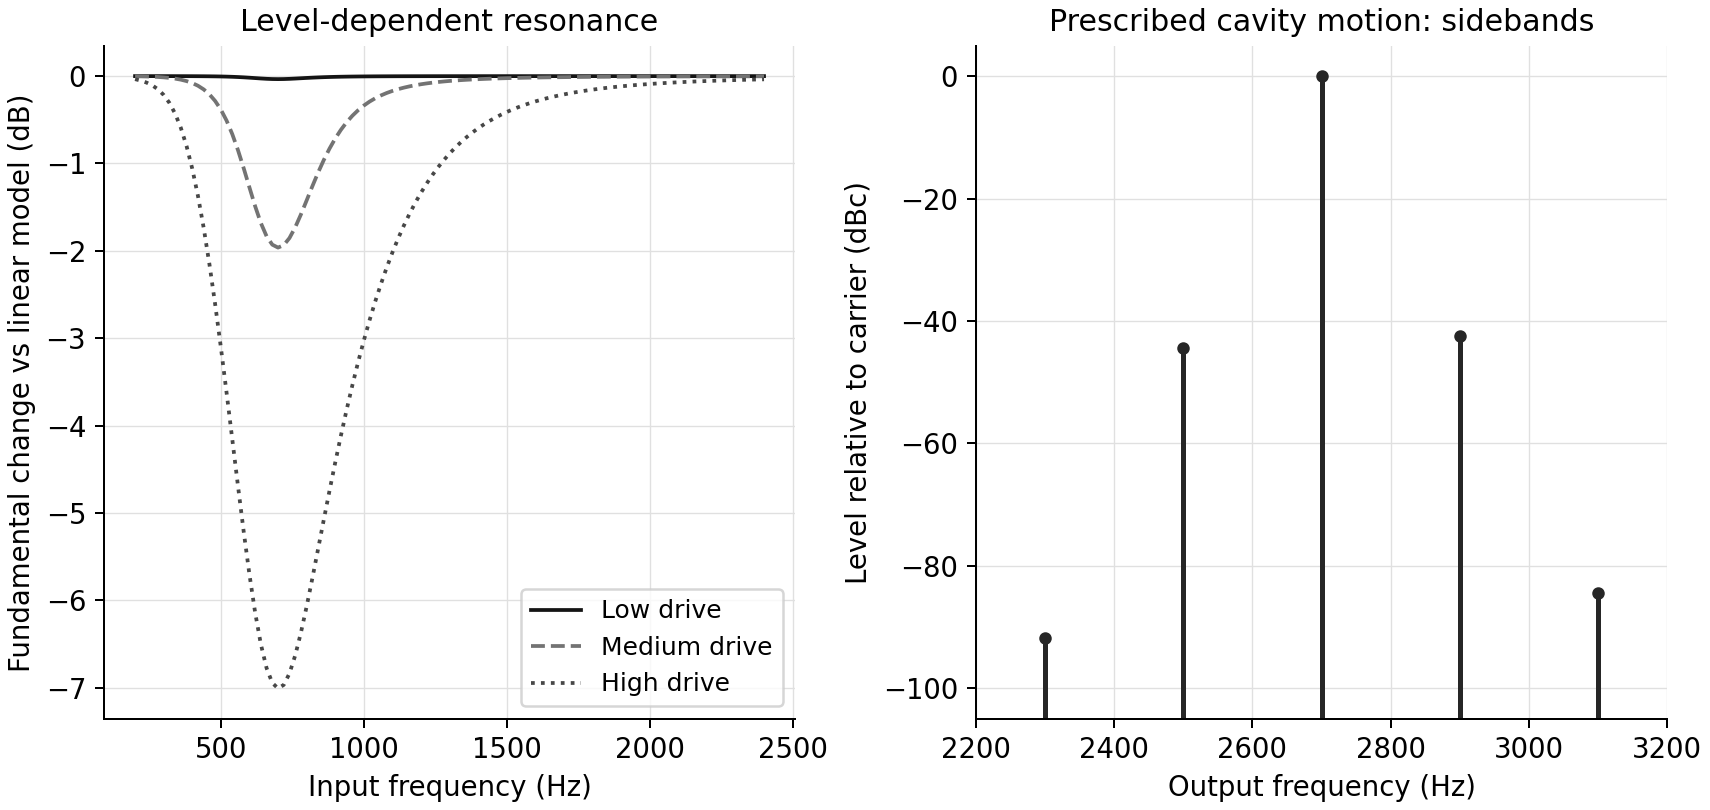
The mechanical model was integrated at 192 kHz. At the tested resonance, the low-, medium- and high-drive fundamental changes were approximately -0.03, -1.96 and -7.01 dB relative to the linear model. Model parameters were specified for the experiment and were not fitted to a measured phone or toy. The separate cavity-filter test used prescribed motion; it did not solve coupled diaphragm-cavity feedback. These experiments establish behavior of the stated models, not calibrated physical-device equivalence.
Mathematical framework
The following equations state the established principles used to interpret the experiments. Detailed processing parameters and reproducibility records are retained internally.
Linear response
y[n] = ∑k h[k] x[n – k]
Here x is the input signal, h the impulse response, and y the filtered output. A fixed impulse response represents linear coloration, phase and ringing. Input-dependent compression and recovery require additional state-dependent processing. Yeh, Bank & Karjalainen, DAFx 2008.
Band-energy estimation
Pb[n] = a Pb[n – 1] + (1 – a) xb2[n]
a = exp(-1 / (fs τ))
Pb estimates the energy in frequency band b; fs is the sampling frequency and τ the smoothing time constant. Separate attack and release constants permit different responses to increasing and decreasing energy. The equation describes a standard analysis component, rather than the complete detector. Giannoulis, Massberg & Reiss, JAES 2012.
Mechanical and cavity resonance
M d2q/dt2 + R(dq/dt) dq/dt + K(q) q = Bℓ i
This lumped mechanical relation expresses mass M, velocity-dependent damping R, displacement-dependent stiffness K and electromagnetic force Bℓi. Displacement is denoted by q. Nonlinear damping and stiffness can change the response with drive level. Klippel, micro-speaker modeling, 2012.
fH = c/(2π) √(A/(V Leff))
The ideal Helmholtz relation connects sound speed c, neck area A, cavity volume V and effective neck length Leff. It assumes a cavity small relative to the acoustic wavelength. Plastic enclosures may also require structural modes and additional losses. UNSW, Helmholtz resonance.
Quantization and coded audio
QΔ(x) = Δ round(x/Δ)
A uniform quantizer maps amplitude to steps of size Δ. Codec bitrate instead constrains the encoded data rate. Packet-loss concealment is a further mechanism that reconstructs missing frames from available decoder state. Opus specification, section 4.4.
Reverberant decay and propagation
E(t) = ∫t∞ h2(τ) dτ
Reverse integration of the squared impulse response estimates the energy remaining after time t. Normalized decay curves allow comparison of reverberant behavior across responses. Brüel & Kjær, reverberation measurement, 1966.
Source direction, listener position, obstruction and reflected paths are evaluated separately in spatial processing. Research on dynamic portal occlusion provides a basis for studying continuous transitions through doorways. Raghuvanshi, dynamic portal occlusion, 2021.
A separate atmospheric-absorption calculation examined frequency, temperature and humidity using ISO 9613-1. Humidity dependence remains an analytical study and is not part of the current real-time propagation model. ISO 9613-1.
Implementation validation and scope
Numerical consistency. Seven fixed-parameter comparisons between the shared processing engine and application processor differed by less than 4 × 10-38 in normalized sample amplitude. Selected Audio Unit (AU) and VST3 plug-in comparisons differed by less than 6 × 10⁻⁸. Restoring their saved settings reproduced identical output samples.
Real-time performance. A macOS CoreAudio test processed 2,841 audio blocks at 48 kHz with 256 samples per block. No processing deadlines were missed and no device underruns were reported. The longest callback took 3.45 ms within a 5.33 ms block period. Physical output was muted. These results apply to the tested computer and processing conditions.
Scope. The figures distinguish measurements of software output from numerical model studies. Model parameters have not been calibrated to every physical device. Perceptual realism requires listening evaluation in addition to these numerical tests.
Melodynamic Studios technical research | Updated 16 November 2026. Figures present recorded software outputs or explicitly identified numerical models. Source records and test configurations are retained internally.
Coming soon
Planned price: $29 USD. Speeek is still in development and is not available to purchase or download yet.
Images show the interface in development. Features and appearance may change before release.



Reviews
There are no reviews yet.